Multi-pipeline CRM for mid-market revenue teams
Relio is a multi-pipeline CRM built for mid-market revenue teams managing enterprise, growth, and expansion segments simultaneously. It consolidates pipeline boards, weighted forecasting, activity traceability, and deal risk surfacing into a single workspace tuned for quarterly execution.
- Client
- Relio
- Service
- SaaS Platform
- Start date
- Sep 2025
- End date
- Dec 2025
- Duration
- 3 months
- Headquarters
- San Francisco, United States
- Team size
- 51-200 employees
- Industry
- Technology
The challenge
Mid-market revenue teams operate across three or four pipelines simultaneously — enterprise renewals, expansion plays, new-logo prospecting, and regional growth — yet most CRMs force that complexity into a single flat list. The result is a tool that technically holds the data but obscures the narrative: which deals are advancing, which accounts are going dark, and where the quarter actually stands.
Forecast reviews become spreadsheet rituals. Managers rebuild pipeline snapshots manually because the system cannot weight probability by stage or segment. Reps toggle between tabs and filters to reconstruct context that should be surfaced automatically. The overhead compounds: by the time a slipping deal is visible, the window to recover it has often closed.
The brief called for a CRM that treated multi-pipeline execution as its organizing principle — not a filter on a generic table, but the foundation of every view, metric, and workflow.
Discovery and research
The discovery phase centered on three user groups: account executives running multi-segment books, sales managers preparing weekly forecasts, and operations leads stitching pipeline data from disconnected sources. Structured interviews surfaced a consistent pattern — the CRM was treated as a reporting obligation rather than a working tool.
Reps maintained parallel tracking systems in spreadsheets because the existing CRM could not represent pipeline-specific stages with distinct probability weightings. Managers described forecast calls as adversarial exercises in data reconciliation. Nobody trusted the numbers on screen because they reflected input compliance, not deal reality.
A competitive teardown of several established CRMs confirmed the structural gap. Most products offered pipeline views as a filter on a unified deal list rather than as a discrete organizational layer. The insight that reframed the engagement: pipeline identity needed to propagate through every surface — forecasts, activity feeds, risk flags — not sit as a label on a deal record.
Competitive landscape
The CRM market splits into two tiers that both underserve mid-market revenue teams. Enterprise platforms offer deep configurability but demand dedicated administrators and months-long implementations. Lightweight tools optimize for speed and simplicity but collapse when a team runs four named pipelines with distinct stages, weightings, and regional ownership models.
Between these poles, a structural gap persists. Products that surface deal risk do so through static reports generated after the fact, not through live views integrated into the daily workflow. Forecasting modules exist as add-ons bolted onto contact databases — they inherit the flat data model underneath and cannot weight probability at the pipeline level without extensive custom configuration.
Relio's positioning occupied the space between these extremes: a purpose-built revenue workspace where multi-pipeline structure, weighted forecasting, and proactive risk surfacing are native to the product rather than layered on through administration. The differentiation was architectural, not cosmetic — it had to live in the data model, not the theme.
Design strategy
Three design principles governed every decision downstream:
- Pipeline identity is sovereign. Every screen inherits the active pipeline context, and switching pipelines reframes the entire workspace rather than toggling a dropdown on a static table.
- Risk surfaces before it is requested. Slipping deals, overdue close dates, and inactive accounts appear in dedicated views and contextual badges, not in reports that require manual generation.
- Density serves the operator. Revenue teams scan large datasets under time pressure — during forecast calls, pipeline reviews, and Monday stand-ups. The interface adopted a data-dense, low-chrome aesthetic that prioritized scannable tables and compact metric cards over decorative whitespace.
These principles created a consistent behavioral contract: wherever a user navigates, they encounter the same information hierarchy — pipeline context at the top, actionable metrics in the middle, granular records at the bottom.
Information architecture
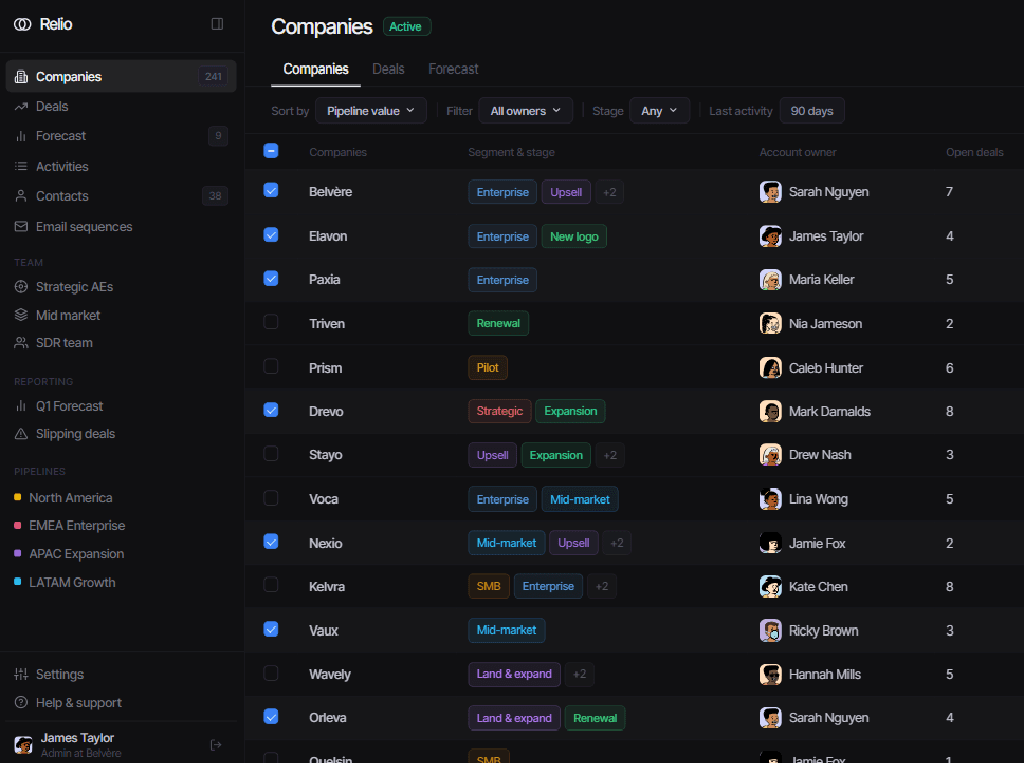
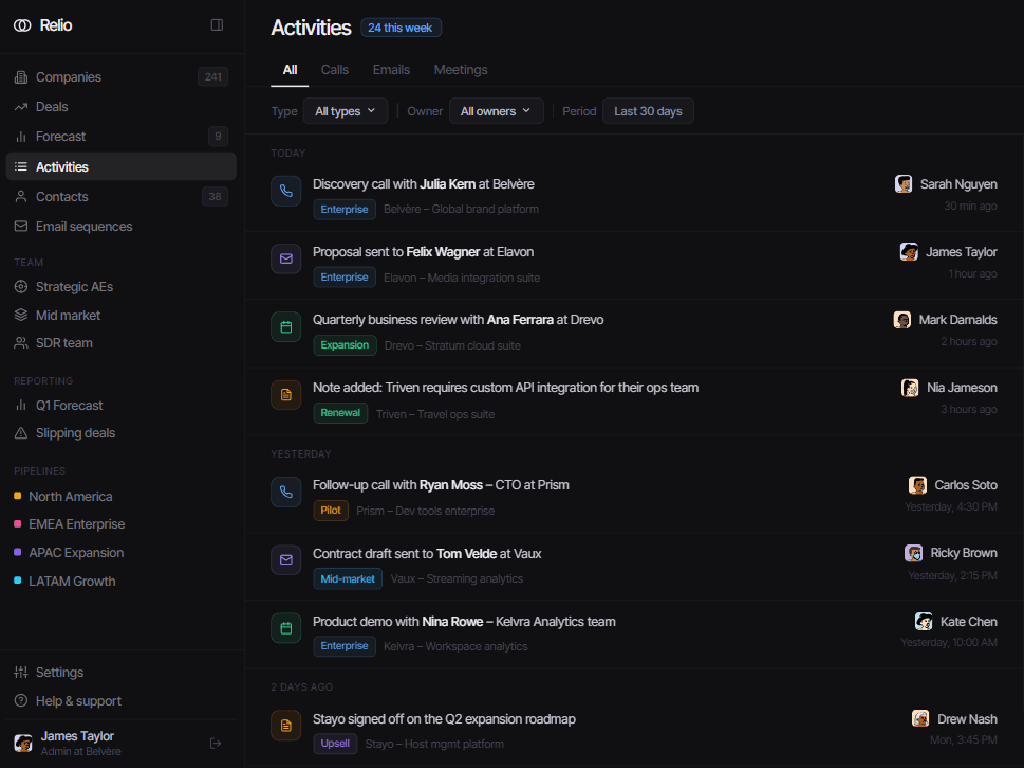
The navigation model organizes the product around two axes: object type and organizational context. The primary sidebar groups seven destinations — Companies, Deals, Forecast, Activities, Contacts, Email sequences, and Slipping deals — corresponding to the core objects a revenue team manages daily. Below these, shortcut groups for teams, reporting, and named pipelines let users jump to a scoped context without manually applying filters.
This dual-axis structure means a sales manager reviewing the EMEA Enterprise pipeline sees companies, deals, and forecasts pre-filtered to that context, while an SDR working the contact list operates within the same shell scoped to their team. The architecture rewards muscle memory — locations are stable, and the cognitive cost of context-switching stays low regardless of role.
On mobile, the architecture compresses gracefully. A bottom tab bar exposes the five most-used views while secondary destinations remain accessible through the collapsed sidebar. The forecast metrics grid adapts from a four-column strip to a two-by-two layout, preserving comparative relationships between figures without forcing horizontal scrolling.
Core experience
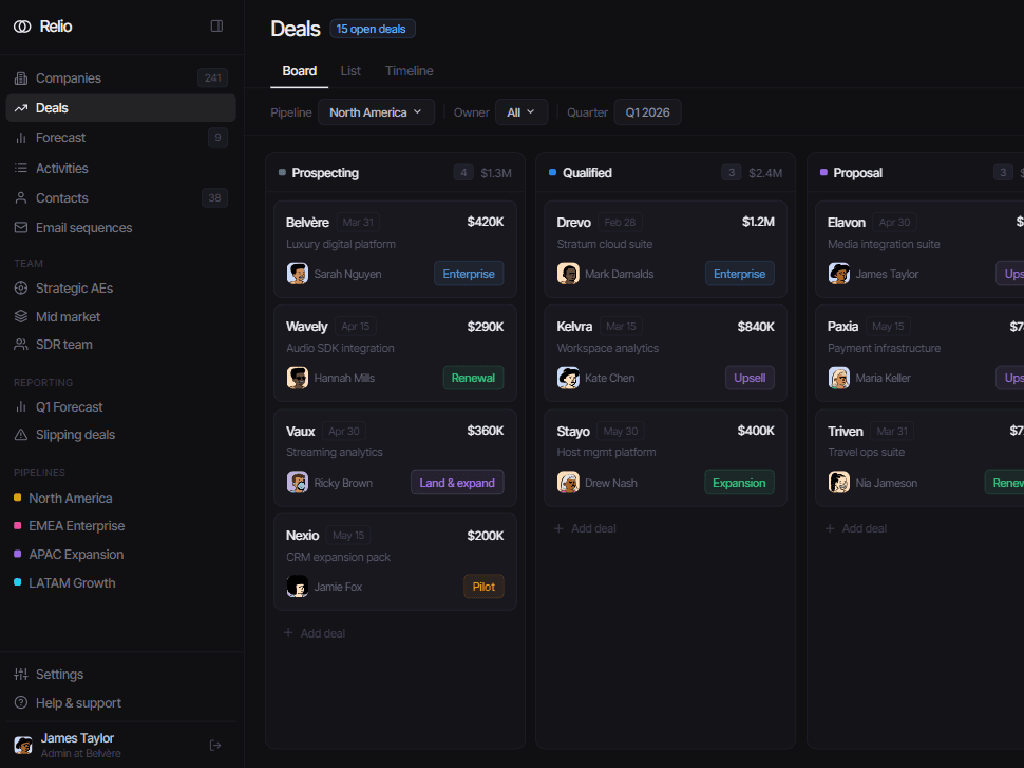
The deals board is the product''s gravitational center. A Kanban layout with five stages — Prospecting, Qualified, Proposal, Negotiation, and Closed won — shows deal cards annotated with close date, amount, owner, and segment tags. Each column header displays the stage total, giving managers an instant read on pipeline distribution without opening a report. A contextual badge flags deals approaching their close date, injecting urgency into a view designed for daily scanning.
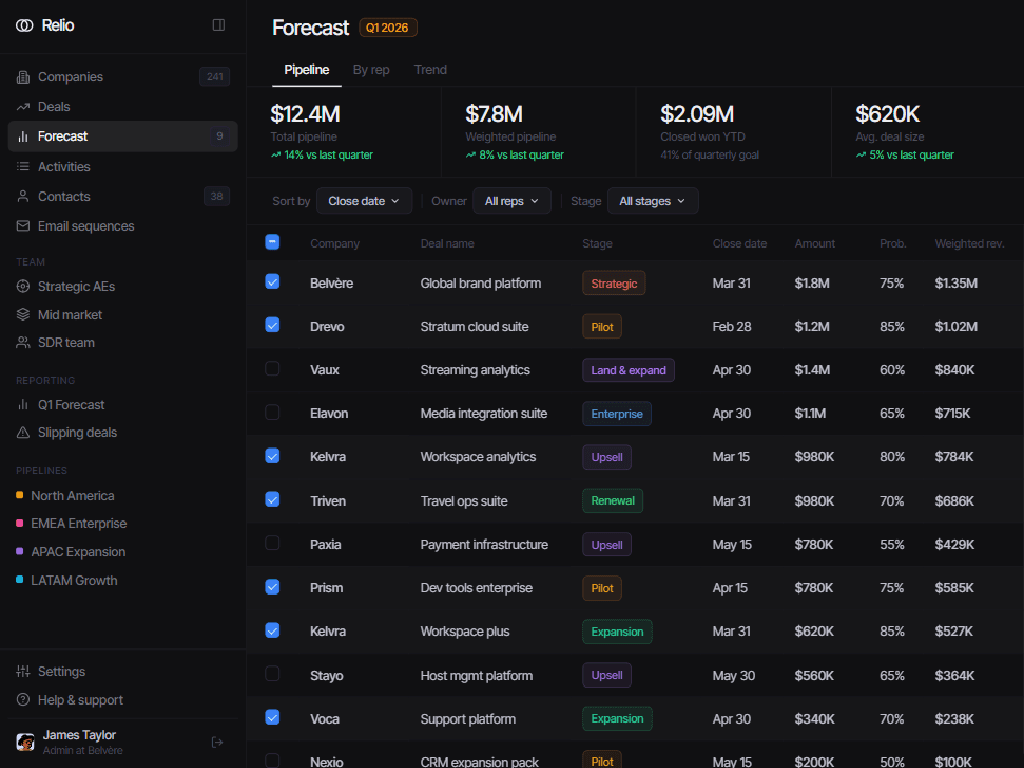
Forecasting operates as a companion to the board rather than a separate module. A metric strip across the top displays four figures — total pipeline, weighted pipeline, closed-won year-to-date, and average deal size — each with a quarter-over-quarter trend indicator. Below it, a sortable table links every open deal to its probability-weighted revenue, making forecast reviews a matter of reading the screen rather than rebuilding a spreadsheet.
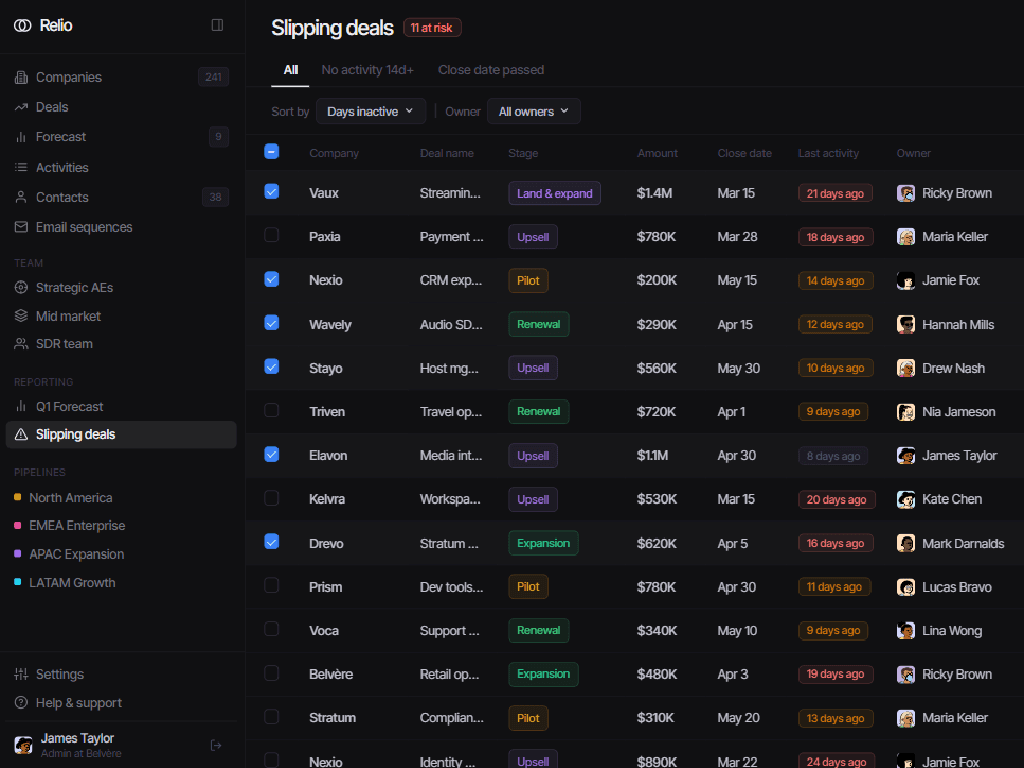
The slipping deals view completes the operational triad. It isolates at-risk opportunities using inactivity thresholds and overdue close dates, grading severity through color-coded badges that escalate from neutral to critical as staleness grows.
Expectations vs. delivery
The original brief described a CRM that could handle multiple pipelines with better visibility than a spreadsheet. The delivered product exceeded that scope in three measurable dimensions:
- Probability-weighted revenue as a native column. The forecast view introduced this capability — mentioned in the brief as a future consideration, not a launch requirement. Including it from day one transformed the forecast from a data dump into a decision surface.
- A dedicated slipping deals view. During discovery, the pattern of deals going dark without timely intervention surfaced repeatedly. Rather than treating this as a reporting feature, the design team elevated it to a dedicated destination in the sidebar — visible on every session, not buried behind a saved filter.
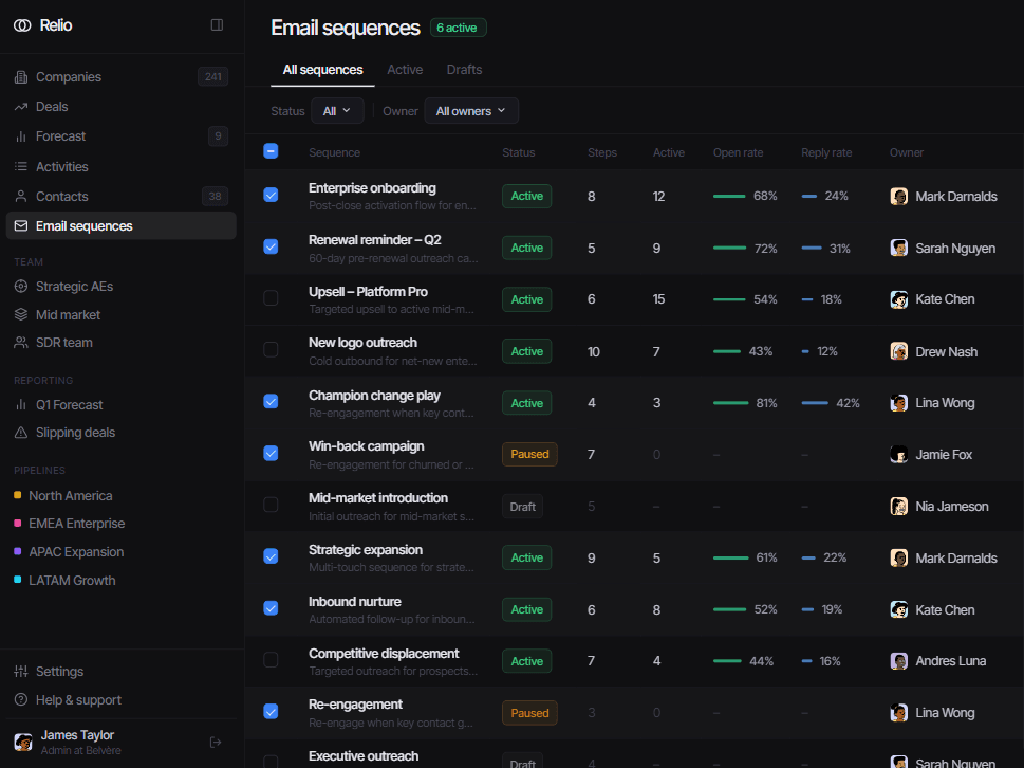
- Email sequences as a pipeline companion. The brief focused on deal tracking; the delivered design included sequence performance metrics — open rates, reply rates, enrollment counts — that connect outreach activity directly to the pipeline it feeds.
Results and impact
The delivered product consolidated pipeline management, forecasting, activity tracking, and outbound execution into a single workspace — eliminating the spreadsheet layer that previously sat between the CRM and the revenue team''s actual workflow. Forecast preparation shifted from a multi-hour ritual of exporting and reconciling data to a direct reading of the weighted pipeline view.
Deal risk became visible earlier in the cycle. The slipping deals view surfaced inactivity and overdue close dates in real time rather than in weekly reports, giving managers a narrower but more actionable window to intervene. Teams reported that pipeline reviews shifted from interrogation to conversation — the data on screen was trusted because it reflected deal reality, not input compliance.
The product''s pipeline-centric architecture opened a clear path for expansion. It supports additional regions and segments without structural changes. Forecasting can extend to multi-quarter trend analysis, and the activity feed provides the foundation for engagement scoring — features that follow naturally from the decisions made in this engagement.